- Bits + Bips
- Posts
- Ethereum Finally Crosses $3,000. Here’s Why It Could Go Higher
Ethereum Finally Crosses $3,000. Here’s Why It Could Go Higher
It finally broke through a key line of resistance. Here’s what’s next.
It is no secret that Ethereum had been having a tough year. It lost ground to its key rivals, the community demanded change, the Ethereum Foundation underwent a major shakeup, and the roadmap was revamped. And questions remain about how it will compete with other layer 1s and even the layer 2 blockchains that it helped spawn.
Despite all of this, it is finally riding some bullish momentum, and its recent performance is blowing past those of its rivals.
I also spoke to some market experts who told me that the token is not done.
Ethereum Finally Crosses $3,000. Here’s Why It Could Go Higher
Ether leaves bitcoin and sol in its wake (ChatGPT)
While bitcoin (BTC) is consolidating after a torrid last week that saw it breach $120,000 for the first time and set a new all-time high above $123,000, ether (ETH), the world’s second-largest cryptocurrency, appears poised to unlock a new level of gains.
Aside from getting a boost from bitcoin’s recent surge and bullish momentum in Washington, D.C., on a couple of key pieces of legislation setting the rules on stablecoins and broader market rules, ether is benefiting from its own crop of crypto treasury companies such as Sharplink (SBET) and Bitmine (BMNR), which have accumulated $866.8 million and $503.8 million worth of the asset, respectively. Additionally, with the crypto treasury company trend just getting started, many more are likely to be on the way.
Currently priced at $3,088, ether is quickly making up ground on other major digital assets like bitcoin and solana (SOL). It is up almost 90% over the past three months, dwarfing the relative performance of the other two assets.
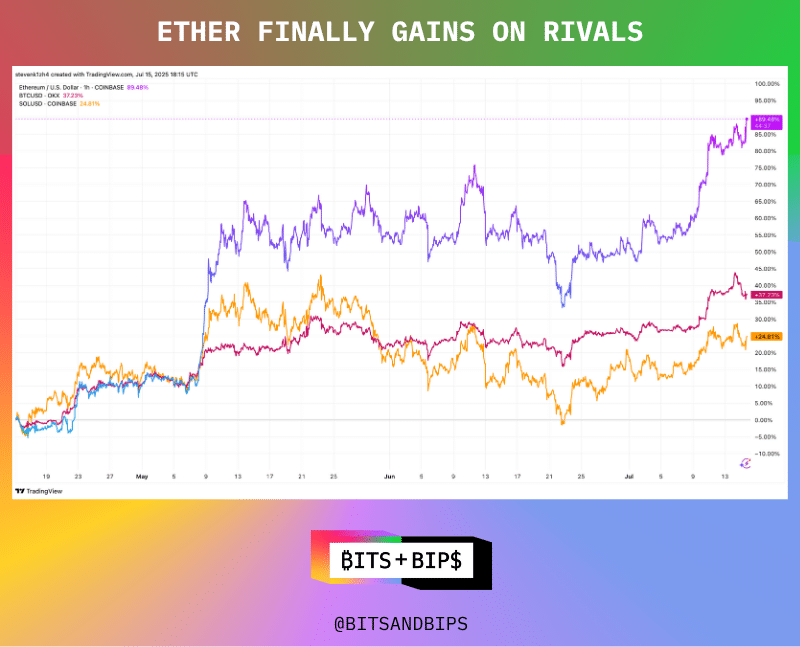
(TradingView)
Ethereum’s price charts show multiple bullish indicators, including a golden cross, which occurs when an asset’s 50-day simple moving average (SMA) line (yellow in the chart below) crosses above its 200-day counterpart (purple), and a positive Moving Average Convergence Divergence (MACD), a popular tool for tracking short-term momentum in technical analysis.
As seen in the chart, ether underwent its golden cross at the very end of June around the same time that the MACD flipped positive. This transition occurs when the MACD line (blue in the bottom chart), which represents the difference between an asset’s 12- and 26-day exponential moving averages (EMA), crosses its signal line (orange), or 9-day EMA. EMAs are similar to SMAs, but they give more weight to recent prices as opposed to SMAs, which give equal weighting to every entry over a given period of time.
Finally, the chart also shows that ether has finally broken through a key level of resistance, its 200-day SMA (purple), which it had been testing since early May. It crossed the 100-day line (brown) back in May.
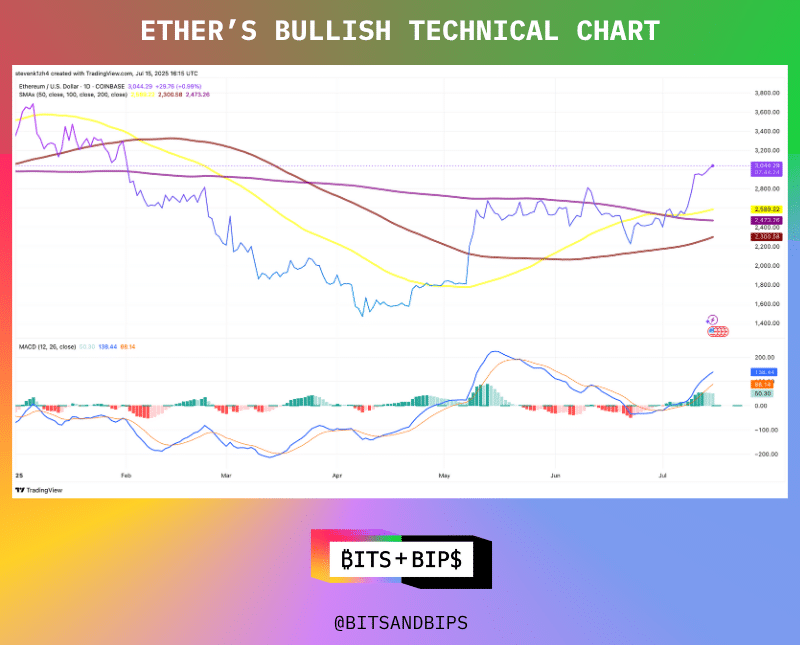
(TradingView)
More Room to Run
Ether also appears to be in an earlier period of its bull cycle than bitcoin. For starters, its MACD crossover occurred below the zero line, which is the point where both the 12- and 26-day EMAs are equal. Crossovers of this type can be seen as an early indicator of a reversal from a negative trend to bullish cycle, which some analysts believe could be a good buying opportunity.
This thesis is supported by bitcoin’s comparative chart, where its crossover happened earlier than ether’s and also occurred around the zero line, accurately indicating that the asset was primed for an upward turn as it did not have to overcome the same type of negative sentiment and price action that ether had been fighting in recent months. Its golden cross also happened back in the middle of May and it crossed the 200-day SMA in April. Its cycle clearly came earlier.
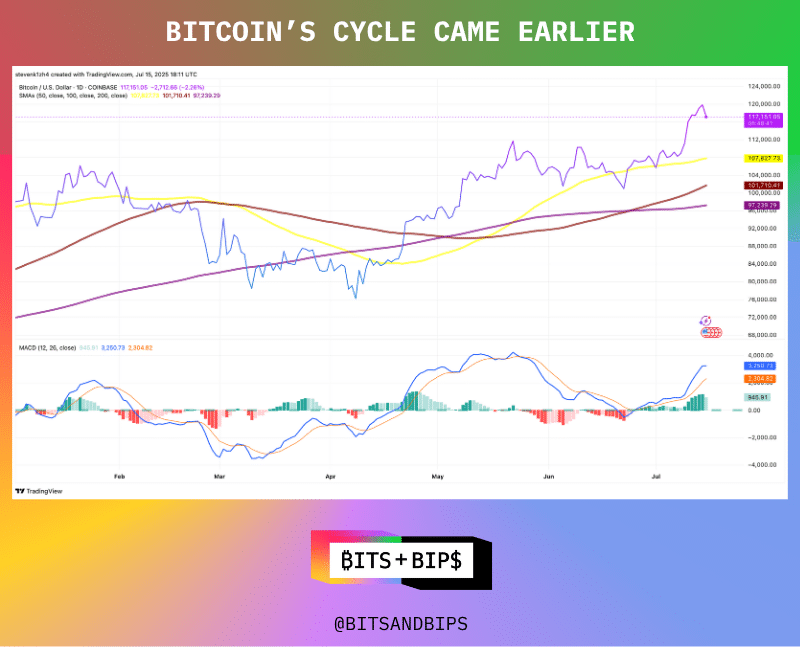
(TradingView)
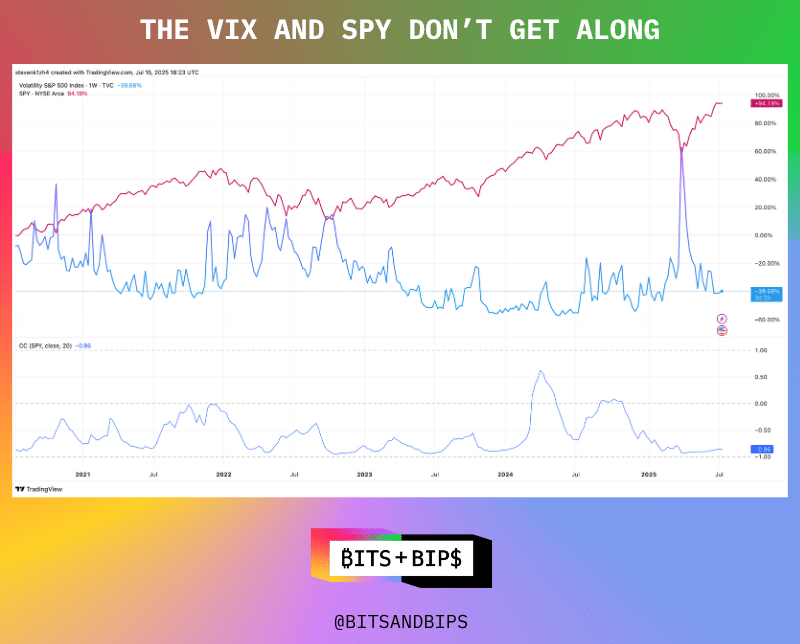
If that was not enough, traders’ expectations of future price movements of ether are diverging from their forecasts about bitcoin’s price trajectory. A useful metric in making such determinations is implied volatility. It is calculated by analyzing the pricing of 30-day options contracts for given assets. In traditional finance the primary tool is the VIX, which stands for the Cboe Volatility Index. The VIX is commonly used as a barometer of expected market volatility, as its price is derived from the pricing of options on the S&P 500 index.
It is often called the “Fear Gauge” in investment circles, because of the consistent inverse correlation between the VIX and SPY. You can clearly see the pattern below.
(TradingView)
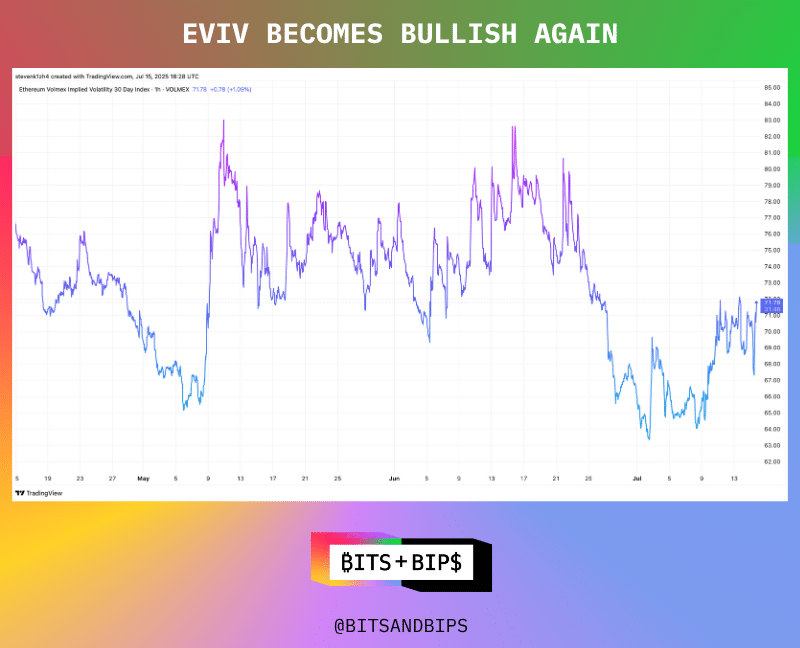
However, these types of gauges work a little differently in crypto, said Cole Kennelly, founder and CEO of Volmex, who produces similar indexes to track implied volatility for assets like bitcoin and ether. “[These indexes] have a very negative correlation when the market is fearful,” Kennelly told Unchained. “But the thing with risk assets like bitcoin and ethereum is that they have this anomaly where there's a positive spot vol correlation in times of greed.”
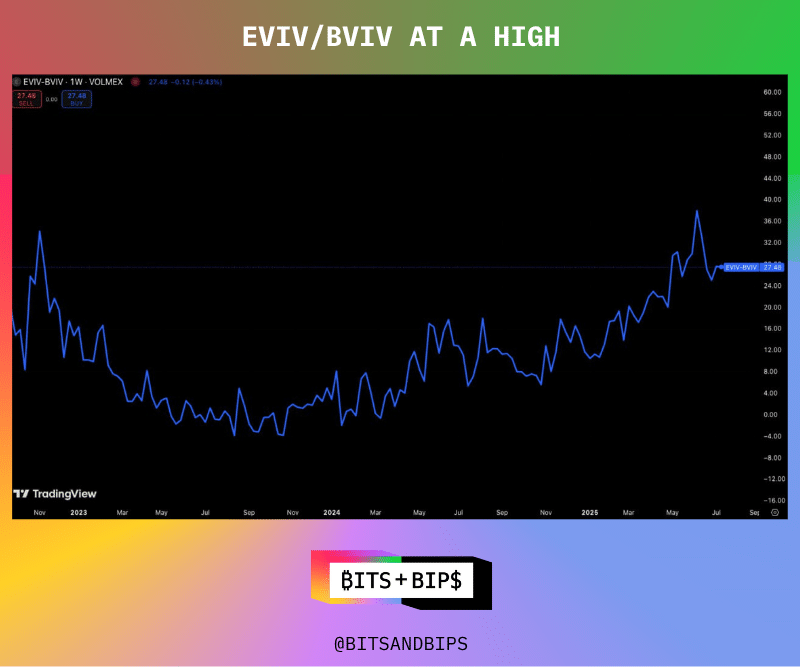
So when it comes to ether, a couple of interesting things are happening. For starters, the Ethereum Volatility Index (EVIV) has started to creep up again after a downturn in late June. But even more importantly, it is gaining on bitcoin (see second chart). In fact, it is at its highest level against bitcoin since 2022. This means that positive momentum is likely to continue.
(TradingView)
(Volmex)
How Much Higher?
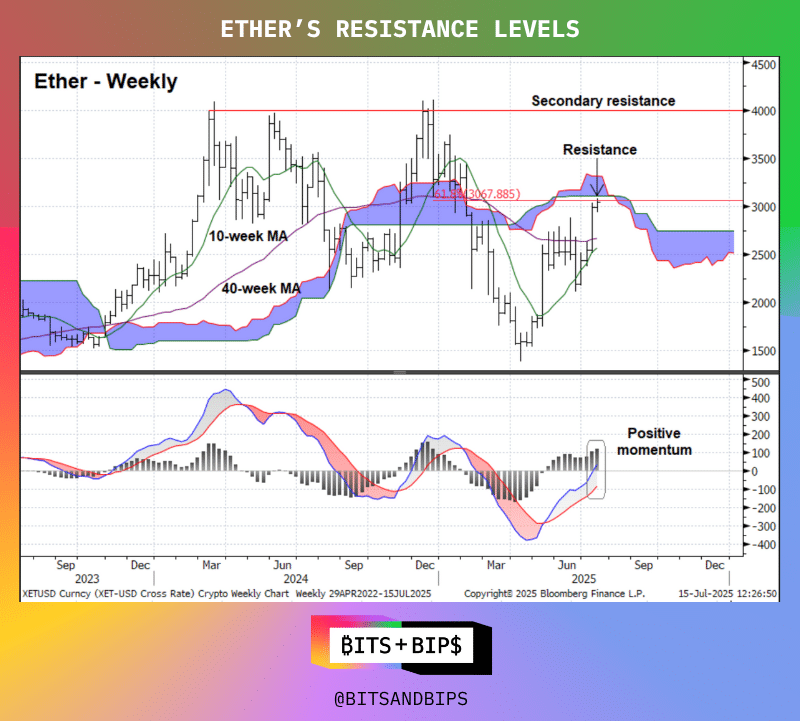
Will Tamplin, senior technical analyst at Fairlead Strategies, told Unchained that the next pocket of resistance will be around the $3,100 mark that ether is bumping up against right now. Therefore, despite the bullish indicators in the above charts, ether might see a period of consolidation before it charts a farther upward course. “[Ether is] overbought, but we don't have any so-called sell signals yet. So it's sort of another proving ground for Ethereum in a sense,” said Tamplin. “It's got another level it has to clear. So I wouldn't be surprised to see some brief just digestion of this recent up, but ultimately all of the evidence I mentioned earlier points to an eventual breakout and resumption of the trend.”
However, when this level gets breached, the next threshold to watch will be $4,000, which ether hasn’t been near since January.
(Fairlead Strategies)
Related content:
Reply